Category: November

Introduction

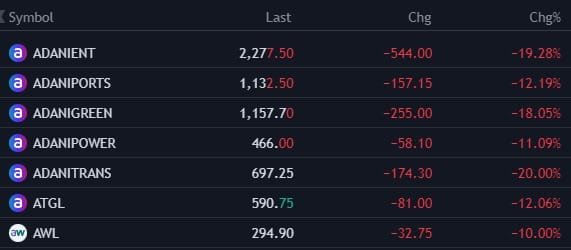
The financial performance and market perception of Adani Enterprises have been under significant scrutiny following the release of the Hindenburg report and subsequent allegations. Most recently, the company’s shares witnessed a dramatic decline after the US Securities and Exchange Commission (SEC) filed charges of bribery and fraud against Gautam Adani and other executives on November 20, 2024.

Financial Performance

Net Profit & Total Income:
Adani Enterprises’ financial performance for the quarter ending in November 2024 showed considerable stress, with a sharp decline in share prices. While specific quarterly data is not explicitly mentioned, the impact of recent events on investor sentiment has been severe.

Year-on-Year Comparison:

Shares dropped 23% to close at ₹2,182.55, with a significant loss of ₹88,726 crore in market capitalization, reflecting a substantial year-on-year decline in investor confidence.

Reason for Losses:
The adverse financial impact stems from allegations of bribery and fraud, as well as the continued fallout from earlier Hindenburg reports accusing the group of financial misconduct.

News in Brief

The SEC’s charges against Gautam Adani, Sagar Adani, and Cyril Cabanes allege involvement in a massive bribery scheme to secure solar energy contracts. The case claims that more than $250 million in bribes were promised to Indian government officials. These allegations have exacerbated existing market concerns, leading to significant volatility in Adani Enterprises’ share price and a broader ripple effect on the Adani Group’s valuation.

Conclusion

The Adani Group’s troubles, starting from the Hindenburg report in January 2023 to the SEC’s recent bribery allegations, have led to severe financial and reputational setbacks. While the conglomerate continues to deny all accusations, the market response reflects waning investor confidence. This timeline highlights the key developments and their impact on the group’s financial health and public perception.

Introduction:

In today’s competitive investment landscape, evaluating companies within the same industry segment is

crucial. When considering options like Swiggy vs. Zomato or Indigo vs. SpiceJet, making informed choices

based on financial performance becomes essential. Here, we look into the financial performance of the

Indian Railway Finance Corporation (IRFC) for the quarter ending on a recent date, highlighting key

metrics that investors should consider when choosing between companies in similar sectors.

Financial Performance:

IRFC’s financial performance for the quarter reflects significant indicators for prospective investors. The

company reported a net profit and total income that demonstrate its solid revenue streams and robust

financial standing. Compared to the same quarter last year, net profit has shown a yearonyear increase,

largely driven by higher income, underscoring the company’s growth potential.

News in Brief:

Investors often find themselves comparing two competitors within the same sector. For IRFC, this

quarter’s strong financial results underscore its resilience and growth potential in a competitive market.

The increase in net profit positions it as a potentially favorable choice in the financial sector, a

consideration relevant for investors facing similar industry comparisons.

Conclusion:

Evaluating companies within the same industry segment involves a careful analysis of each company’s

financial performance, market outlook, and growth potential. IRFC’s solid quarterly financials, including

its impressive net profit growth, make it a compelling choice for investors. As the market evolves,

focusing on these key financial metrics will be essential for capitalizing on future opportunities.

Introduction

Swiggy has emerged as India’s largest online food ordering and delivery platform, achieving impressive

milestones in growth, service diversification, and financial backing. In this blog, we’ll explore Swiggy’s

remarkable journey to becoming a “unicorn” startup in less than four years and examine the factors

driving its continued success. Additionally, we’ll touch on the financial performance of Swiggy for a

recent quarter.

Financial Performance

For the quarter, Swiggy reported robust growth in its financial metrics. Key highlights include:

Net Profit: Swiggy achieved a strong net profit.

Total Income: Swiggy recorded substantial total income.

Comparing year over year performance, Swiggy demonstrated a significant increase in net profit, largely

attributed to a rise in total income. This consistent profit growth reinforces Swiggy’s standing as a leader

in the competitive food delivery industry.

News in Brief

Swiggy’s rapid success can be attributed to several strategic steps:

Rapid Growth: Swiggy experienced accelerated revenue growth early on, drawing substantial

investment interest. Notably, Swiggy attained unicorn status within four years of its inception, a rare

feat in India’s startup landscape.

Diverse Service Offerings: Expanding beyond food delivery, Swiggy introduced various services to meet

the evolving needs of Indian consumers. Key offerings include:

Swiggy Pop: Single serve meal delivery.

Swiggy Cloud: A cloud kitchen service to enable scalable meal prep.

Swiggy Stores: A retail service allowing customers to order from local stores.

Swiggy Go: An on demand pickup and drop off service for items like clothing and documents.

Conclusion

In conclusion, Swiggy’s success story is a product of its strategic diversification, investment in technology

and logistics, and strong leadership. The company’s emphasis on automation, data sciences, and

personalized services has strengthened its position in India’s competitive food delivery market. With

Swiggy’s ongoing expansion, robust financial performance, and consistent innovation, it is poised to

remain a top player in the industry

Introduction:

Bitcoin’s rise in the cryptocurrency market continues to grab the attention of investors and analysts

alike. As of the latest market developments, Bitcoin is at an inflection point, prompting investors to

rethink their financial strategies. In light of recent financial performance and growing market

acceptance, Bitcoin is increasingly being viewed not just as a speculative asset, but also as a potential

store of value. This blog post delves into Bitcoin’s financial performance, its growing correlation with

traditional stock markets, and the opportunities it presents for investors today.

Financial Performance:

Bitcoin’s financial performance remains strong, despite its volatility. Over recent quarters, Bitcoin has

demonstrated impressive growth in market value, which reflects an increasing demand for this digital

asset. As more investors enter the crypto space, Bitcoin’s market acceptance continues to grow, and

long-term holders are witnessing substantial returns.

In terms of net growth, Bitcoin’s price surged notably in 2021, quadrupling in value before stabilizing.

This robust growth reflects the broader trend of increasing institutional interest in Bitcoin-linked

products, such as exchange-traded funds (ETFs), and a rising volume of Bitcoin trades. However, unlike

traditional equities, Bitcoin does not offer dividends or other claims to assets, which makes its financial

metrics difficult to compare directly to stocks. Despite this, its performance remains a key factor in the

broader cryptocurrency market’s growth.

News in Brief:

Bitcoin’s Big Bang Moment Is Impossible to Ignore

Katie Martin’s recent article on Bitcoin emphasizes the evolving role of Bitcoin in the financial landscape.

While it may not yet function as a practical daily currency for transactions like buying coffee or paying

taxes, Bitcoin’s role as a store of value and investment asset is expanding rapidly. This shift in perception

is being driven by increased market acceptance, both from retail and institutional investors, signaling

that Bitcoin could be on the cusp of its “big bang” moment in the financial world.

Relation Between Bitcoin and the Share Market:

The correlation between Bitcoin and traditional stock markets has been a topic of increasing interest

among investors. While Bitcoin was initially viewed as a completely independent asset class, recent

trends suggest a growing connection between cryptocurrency and equities, particularly during times of

market volatility. Both Bitcoin and the stock market tend to react similarly to macroeconomic factors

such as investor sentiment, economic conditions, and geopolitical events. For example, during times of

economic uncertainty or market downturns, Bitcoin has demonstrated significant price movements,

much like traditional equities.

However, this relationship is not one of direct causality. The correlation is driven largely by market

participants perceiving Bitcoin as a speculative asset, similar to stocks. As institutional investors

increasingly enter the crypto market, the lines between the traditional stock market and the

cryptocurrency market are becoming blurred. Although Bitcoin’s volatility remains higher than that of

most stocks, its growing market participation has made it more closely tied to broader financial trends.

Conclusion:

Bitcoin’s journey continues to captivate both individual and institutional investors. While its price

volatility remains a concern, the digital asset is proving to be a powerful force in the financial world. As

Bitcoin reaches its “big bang” moment, it presents a unique opportunity for those looking to diversify

their portfolios and take advantage of the crypto market’s potential. However, investors should proceed

with caution, given Bitcoin’s speculative nature and the regulatory uncertainty that may arise in the

coming years. Additionally, its increasing correlation with traditional stock markets highlights the need

for investors to stay informed about both sectors to make well-rounded investment decisions.
Introduction

Penny stocks often carry a reputation for volatility and risk, but they can also offer substantial returns

when chosen wisely. For investors seeking to uncover hidden gems in the market, understanding how

penny stocks can transform into multibaggers over time is key. This blog post explores the financial

journey of certain penny stocks, offering insights on how investors can identify stocks with high growth

potential and reap impressive returns. Additionally, we’ll look at some examples of penny stocks that

have delivered remarkable returns and discuss the role of effective strategies and market conditions in

these success stories.

How to Pick the Right Penny Stock

Choosing a penny stock with multibagger potential requires a careful analysis of several key factors:

1. Financial Health: Examine the stock’s earnings, profit margins, and revenue growth over recent

quarters.

2. Industry Trends: Select companies operating in booming industries or those with a strong growth

outlook.

3. Management Team: Assess the management’s track record and their commitment to expanding

business.

4. Volume and Liquidity: Ensure there’s enough trading volume to facilitate buying and selling without

causing extreme price fluctuations.

5. Long Term Potential: Look for companies with a clear growth plan and expansion strategy.

Conclusion

Identifying multibagger stocks among penny stocks involves understanding market conditions, financial

performance, and company potential. With a disciplined approach, investors can navigate the world of

penny stocks and potentially achieve impressive returns. This blog has explored how certain stocks have

become multibaggers, providing insights and strategic recommendations for investors aiming to make

the most of penny stock investments. With careful analysis and a balanced investment strategy, you too

can discover valuable opportunities in the penny stock market.

Introduction

As Donald Trump gears up for his second term in office, the economic outlook he presents raises

concerns and opportunities for global markets. With proposals for radical changes in trade, immigration,

and fiscal policy, Trump’s second term could significantly affect U.S. and global economic conditions,

including India’s growth trajectory. This blog post examines the key proposals under Trump 2.0 and the

potential implications on the global economy and Indian markets.

News in Brief

In his second term, Donald Trump has outlined several radical economic plans that could reshape U.S.

trade and fiscal policy. These include:

1. Tariffs: A proposed 20% tariff on all imports and a staggering 200% duty on cars.

2. Immigration: A controversial plan to deport millions of irregular immigrants.

3. Tax Cuts: An extension of tax cuts, despite the U.S. budget deficit reaching a record high.

These proposals, if implemented, could lead to macroeconomic challenges, not only for the U.S. but also

for global markets. Despite these risks, many analysts view Trump’s presidency as a positive for

American stocks and the U.S. dollar, though concerns about fiscal profligacy and treasury risks linger.

Market Outlook

Trump 2.0 could bring challenges for India’s growth prospects. Possible disruptions in global supply

chains, increased trade wars, and the imposition of tariffs may harm Indian exports and global fund

flows. Additionally, heightened forex volatility could pose risks for Indian businesses and investors.

While these concerns are valid, there are also opportunities. Indian companies with strong domestic

exposure and those in sectors that may benefit from increased U.S.India trade could potentially see

positive outcomes. For example, sectors such as technology, pharmaceuticals, and financial services

might adjust to global shifts and emerge resilient.

Conclusion

Donald Trump’s second term in office could bring significant changes to global trade dynamics, U.S.

fiscal policies, and the global investment climate. While the proposed tariffs, immigration policies, and

tax cuts may lead to disruptions, they also create potential investment opportunities in sectors less

sensitive to global volatility. Indian companies, particularly in tech, pharmaceuticals, and finance, will

need to closely monitor these changes and adapt their strategies accordingly. Investors should stay alert

to how Trump’s economic plans evolve, as they may present both risks and rewards for Indian markets

in the long term.

Introduction:

The recent quarter has been eventful for Indian markets, responding to both global and local

influences. Notably, Donald Trump’s return to the White House has taken center stage. Despite

the initial optimism in US markets following Trump’s victory, Indian benchmark indices, Sensex

and Nifty, saw declines as investors began assessing potential policy impacts and economic

shifts.

Financial Performance:

This quarter showed positive growth for key shares, with steady increases in total income and

net profit on a year-over-year basis. The company’s growth was largely driven by factors such

as higher revenue in specific sectors and an improving economic environment.

News in Brief

Indian markets opened lower after a surge in the US markets. Despite the strong performance

of US stocks, concerns over Trump’s potential policies have created unease among Indian

investors. Key factors weighing on the market include:

1. “America First” Trade Policies: Trump’s focus on “America First” policies has raised

concerns over potential tariff hikes on Indian exports, which could impact several sectors,

including IT and manufacturing.

2. Inflation and Interest Rate Concerns: Expectations that Trump’s policies could drive

inflation have created uncertainty about the US Federal Reserve’s interest rate policy, indirectly

impacting global markets, including India.

3. Foreign Investment Outflows: Rising US interest rates may lead foreign investors to

withdraw capital from emerging markets like India, putting additional pressure on the rupee and

local markets.

4. IT Sector’s Mixed Impact: Although Trump’s proposed tax cuts may boost domestic

production, the effect on Indian IT firms remains mixed as they balance new opportunities with

potential challenges due to outsourcing scrutiny.

While sectors such as IT showed mixed performance, other sectors experienced more

significant declines as investors evaluated these risks.

Conclusion

Indian stock markets have responded cautiously to Trump’s victory, with declines seen across

major indices. The potential impact of his policies—especially on trade, interest rates, and

foreign investments—will likely continue to shape the market outlook. While certain stocks show

resilience due to strong fundamentals and favorable domestic growth prospects, a cautious and

informed investment approach is advised as the implications of new US policies unfold.

Introduction:

Samvat 2081 is shaping up to be an exciting year for gold investors. With the new financial year marking

a fresh start for investors in the Hindu calendar, coinciding with the auspicious festival of Diwali, experts

have high expectations for gold’s performance in this period. After a strong showing in Samvat 2080,

gold is set to deliver an impressive return, with analysts forecasting gains of 15-18% in the coming year.

This blog post takes a closer look at the reasons behind this positive outlook and why Samvat 2081 is

crucial for Indian investors.


Financial Performance:

Gold’s performance in Samvat 2080 (October 2023 to October 2024) was nothing short of stellar. The

precious metal delivered over 30% returns, outperforming many asset classes, including the Nifty index,

which saw a 25% return. This strong performance was driven by geopolitical tensions and escalating

global conflicts, which boosted gold’s position as a safe-haven asset. The interest rate cycle in major

economies also played a crucial role in supporting the price of gold, making it a preferred investment

during uncertain times. As of October 29, 2023, the price of gold surged by 35%, reaching Rs 61,200 per

10 grams, with continued momentum through the year.


News in Brief:

Samvat 2081 (October 2024 to October 2025) marks an important period for Indian investors, not only

due to its symbolic start of the new financial year but also because of the optimistic outlook for gold.

Experts predict a stellar performance for the precious metal, with a potential return of 15-18%. Analysts

point to several key factors, such as positive economic indicators and safe-haven demand, which are

expected to drive this growth. The potential for further gains may also be influenced by a reduction in

import duties, continuing the strong buying momentum seen in the previous year.


Market Outlook:

The outlook for gold in Samvat 2081 remains largely bullish. Experts like Jateen Trivedi, Vice President of

Research for Commodities and Currency at LKP Securities, expect a base performance of 10% in gold’s

price but foresee the possibility of 15-18% returns. This positive outlook could materialize if the import

duty cut continues to incentivize buying, or if gold benefits from a stable interest rate environment.

However, any increase in import duties could still push gold’s performance higher than expected,

potentially surpassing the 15% gain mark.


The market sentiment remains positive with sustained demand, and there is potential for further buying

from exchange-traded fund (ETF) investors as central banks continue their purchases. With this

momentum in play, the gold market is expected to maintain its steady growth in the coming year.


Conclusion:

As Samvat 2081 unfolds, gold remains a key asset for investors looking for stable returns amidst global

uncertainties. With analysts predicting solid returns of 15-18% and experts emphasizing the role of

global factors such as economic stability and import duties, gold is poised to continue its strong

performance. Investors can expect a promising year ahead, making it a crucial time to stay informed and

consider the potential of gold as part of a diversified portfolio. The performance of the metal in Samvat2080 has set a strong foundation for this positive outlook, and it’s clear that gold will remain a valuable

asset in the coming year.

Introduction:

The global commodity market has seen significant fluctuations in recent years. However, recent

projections by the World Bank suggest that commodity prices will experience a notable decline through

2026. This shift is largely driven by changes in global supply and demand dynamics, with a particular

focus on oil prices. The World Bank’s October 2024 Commodity Market Outlook forecasts a drop in

commodity prices, bringing them to their lowest levels since 2020. In this blog, we will delve into the key

projections for commodity prices and their potential economic implications.


Financial Performance:

As we assess the potential decline in commodity prices, it’s crucial to consider how it may impact

companies within the commodity trading, production, and investment sectors. For companies reliant on

high commodity prices—particularly in industries like energy, mining, and agriculture—this price

reduction could significantly affect their revenues and profit margins.

For instance, lower oil prices could benefit industries like manufacturing, logistics, and energy, as it

reduces operational costs. However, firms involved in the extraction or production of raw materials

could face reduced profits due to the lower prices of the commodities they sell.


News in Brief:

Commodity prices are projected to decline significantly in the coming years, according to the World

Bank’s Commodity Market Outlook report. The outlook predicts a 5% decline in commodity prices in

2025, followed by an additional 2% drop in 2026, driven primarily by a fall in oil prices. The World Bank

suggests that oil prices, which are expected to average INR 6,720 per barrel in 2024, will decline to INR

6,570 per barrel in 2025 and INR 6,480 per barrel in 2026. Along with oil, metals and agricultural

products are expected to see minor price adjustments, though they will remain relatively stable.

Here’s a snapshot of the projected prices for key commodities in INR:


Oil Prices: Forecast to drop from INR 6,720 per barrel in 2024 to INR 6,480 per barrel by 2026.

Copper Prices: Expected to remain stable with minor fluctuations, averaging INR 6,40,000 per ton in

2024, reducing slightly to INR 6,13,000 per ton in 2025, and increasing slightly to INR 6,22,000 per ton in

2026.

Wheat Prices: Projected to decrease from INR 22,400 per ton in 2024 to INR 21,600 per ton in 2025,

before recovering to INR 22,000 per ton in 2026.


Example Chart of Projected Price Movements:

Screenshot 2024 11 07 182127

This table clearly highlights the expected decline in oil prices, with copper and wheat prices showing more modest adjustments.

Picture 

Picture1


Conclusion:

In conclusion, the World Bank’s projections for a decline in global commodity prices signal a significant

shift in the market, particularly driven by lower oil prices. As this trend unfolds, companies in the

commodity sector will need to adjust their strategies to cope with the stabilizing supply demand

conditions. While the outlook remains cautious for some sectors, lower commodity prices could present

opportunities for businesses positioned to benefit from reduced input costs.

Investors should carefully monitor market trends and the financial performance of companies that are

heavily exposed to commodity prices. By keeping a close watch on these shifts, they can make informed

decisions in navigating the changing commodity landscape over the next few years.